My Experience with Business Development at Infosys Springboard
Business Intelligence Analyst & Data Visualization Specialist
Hi, I'm Onkar Devkar, a Business Intelligence specialist who helps companies unlock the power of their data. I transform complex datasets into clear, interactive dashboards that drive smarter business decisions.
1+ years of experience in Business Intelligence and Data Analytics
Expertise in Power BI, Tableau, Excel, and SQL
Proven track record of delivering measurable business results
Quick turnaround time with 100% client satisfaction focus
Ready to turn your data into your competitive advantage?
Get StartedFrom interactive dashboards to comprehensive data analysis, I provide the tools you need to make informed business decisions.
Explore ServicesLet's collaborate to transform your business data into actionable insights that drive growth and efficiency.
Let's ConnectBusiness Intelligence Specialist & Data Visualization Expert
I'm Onkar Devkar, a Business Intelligence specialist who helps companies unlock the power of their data. With over 3 years of experience in Business Intelligence and Data Analytics, I transform complex datasets into clear, interactive dashboards that drive smarter business decisions.
My approach combines technical expertise with business acumen to deliver solutions that not only look great but also provide actionable insights. I believe that effective data visualization is about telling a compelling story that drives strategic decision-making.
Whether you need comprehensive business intelligence dashboards, detailed data analysis, process optimization, or custom analytics solutions, I'm here to help you transform your data into your competitive advantage.
Let's Work TogetherLet's discuss how I can help transform your business with powerful data insights.
Expertise that drives data-driven success
Expert in DAX, Power Query, and creating custom visuals for interactive dashboards.
Proficient in dashboard creation, calculations, and data visualization techniques.
Advanced skills in pivot tables, VBA, and complex formulas for data analysis.
Expert in complex queries, stored procedures, and database optimization.
Proficient with Pandas, Matplotlib, and data analysis libraries.
Fundamental knowledge of statistical analysis and data visualization.
Expert in database management, query optimization, and integration services.
Proficient in database design, administration, and performance tuning.
Experienced in tracking, reporting, and analyzing website performance metrics.
Skilled in CRM data analysis and reporting dashboard creation.
Experienced in document management and collaborative reporting solutions.
Database design, normalization, and indexing
Delivering value beyond expectations
Most projects completed within 3-7 days. I understand that business insights can't wait.
Deliver enterprise-level results at freelancer prices. No overhead, just results.
I don't just create charts - I solve business problems. Every visualization tells a story that drives action.
Regular updates, clear explanations, and always available for questions. English proficiency ensures smooth collaboration.
Free revisions and 30-day support included with every project. Your success is my priority.
Rigorous testing and validation ensure your dashboards are accurate, reliable, and user-friendly.
Feedback from satisfied clients


Check out my recent work

This project focuses on extracting insights from a retail sales database using SQL. I performed data cleaning, joined multiple tables, and wrote analytical queries to uncover trends like top-selling products, sales by region, and performance of sales representatives. Key concepts used include:Joins (INNER, LEFT, RIGHT) Aggregations and Grouping Subqueries and CTEs Window Functions Data Filtering and Sorting
View DetailsModern dashboard for financial analytics with interactive charts
View Details
This project involved designing a complete business model framework for a startup idea using industry-standard strategies. I used tools like the Business Model Canvas and SWOT analysis to map out the company’s core structure and value delivery system.
DownloadComprehensive analysis of IPL datasets with insights, trends, and visualizations for team and player performance.
View DetailsComprehensive analysis of sales data during the Diwali festival with detailed visualizations and insights.
View DetailsThis project analyzes the **Diwali Sales dataset (Vrinda Store)** to uncover customer insights and sales patterns.
View DetailsSpecialized services to transform your data into actionable insights
Create interactive, real-time dashboards that give you instant insights into your business performance
Transform raw data into actionable insights that drive business growth
Streamline your reporting processes and eliminate manual work
Tailored analytics solutions designed for your specific business needs
Extract data from various sources (Excel, databases, APIs, web) Clean, preprocess, and structure your raw data for analysis Remove duplicates, handle missing values, and ensure data quality
Visual storytelling for faster decision-making
Build interactive dashboards using Power BI, or ExcelGenerate custom reports with charts, KPIs, and insights
Real-world business intelligence solutions that deliver results

Client was spending 20+ hours weekly creating manual reports and struggled to identify sales trends quickly across multiple store locations and product categories.
Developed an automated Power BI dashboard that consolidates data from 5 different sources and provides real-time sales insights with drill-down capabilities by region, product, and time period.

Financial institution needed to consolidate data from multiple systems to track performance metrics and identify growth opportunities while ensuring regulatory compliance.
Created a comprehensive Tableau dashboard suite that integrated data from 7 sources, providing a unified view of financial performance with automated compliance reporting.
My professional journey
Developed Many Projects on Real-Time Data During Traning.
Lead a team to get responsive insights.
Recent Blog Posts
My Experience with Business Development at Infosys Springboard
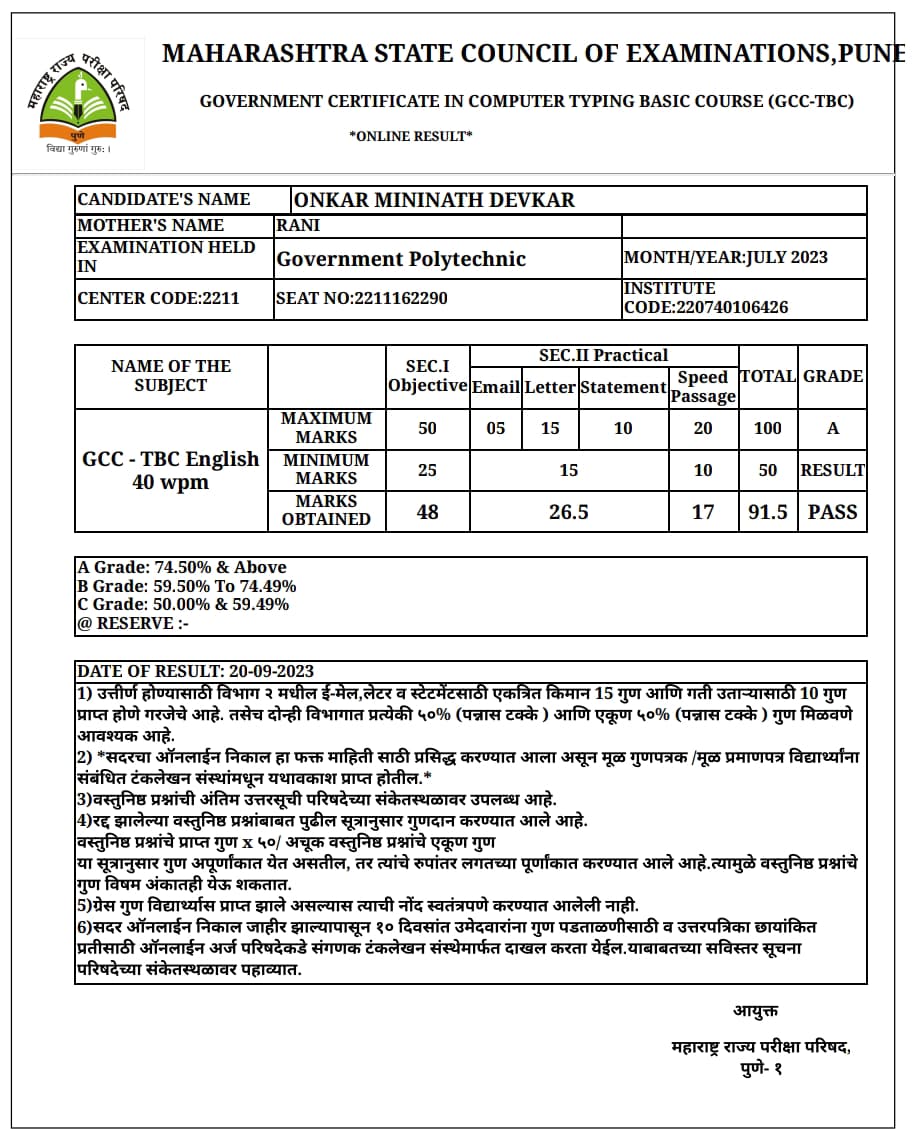
Mastering Typing for Speed and Accuracy — My GCC-TBC Certification Journey

Building a Strong Python Foundation — Certified by IIT Bombay

Contact Us